Attention on protein structures
One thing I have been curious about with regard to inverse folding models such as ProteinMPNN and ESM-IF is what the model's attention mechanism is choosing to focus on in different situations. I've been surprised at places where these models perform well, and places where they don't, and I think maybe examining the attention mechanism in the light of biology might help me understand why.
It's always good to think about what you're asking a model to do, and to try to do it yourself. After all, ML models are really for doing things we don't want to do over and over. During a protein design project, I will often make design selections for a specific residue by looking at a crystal structure. Actually, that's often the first thing I do when I am studying a new enzyme class looking to engineer an enzyme. Say I am trying to engineer a dehydratase enzyme that creates a double bond in a long, greasy substrate. I have a crystal structure, and I am trying to engineer the enyzme to accept a smaller substrate. One of the first things I will probably do is look carefully at the structure in PyMOL and design some mutations.
Conceptually, the inverse folding model is doing the exact same thing. During the decoding phase, given a residue index, the model "looks at" the (transformed) features of all the edges in its neighborhood, and outputs a probability distribution over the 20 potential residues.
So I would like to take a look myself at what the model "sees", by showing a 3-D structure in PyMOL with the model's attention weights painted on the different residues.
Training a StructureTransformer
In order to examine this, I implemented a simple inverse folding model, using John Ingraham's Struct2Seq implementation, but borrowing the featurization from ProteinMPNN. Since ProteinMPNN is a modified version of John's original code, this implementation approximates the capacity of ProteinMPNN without the ability to handle multiple chains. This model strikes a good balance between expressiveness and simplicity for an afternoon blog post.
For a dataset, I followed Ingraham in using the CATH dataset. I trained a model with a hidden dimension of 128, and neighborhood size of 32, and modified the network to output the per-residue attention weights from each head and layer during inference.
Examining the attention mechanism
First, we'll need to focus on a single protein to look at. I chose a small, globular protein (PDB code 1BIR) to examine. Within this protein, I selected a residue (Tyr-11) somewhat arbitrarily. Note, this protein has both a ligand and a metal ion in it. Part of my motivation here is to see what the attention mechanism looks at for catalytic residues, and see if we can improve the model by adding ligands. But for now let's look at Tyr-11 in 1BIR, through the "eyes" of our model's attention.
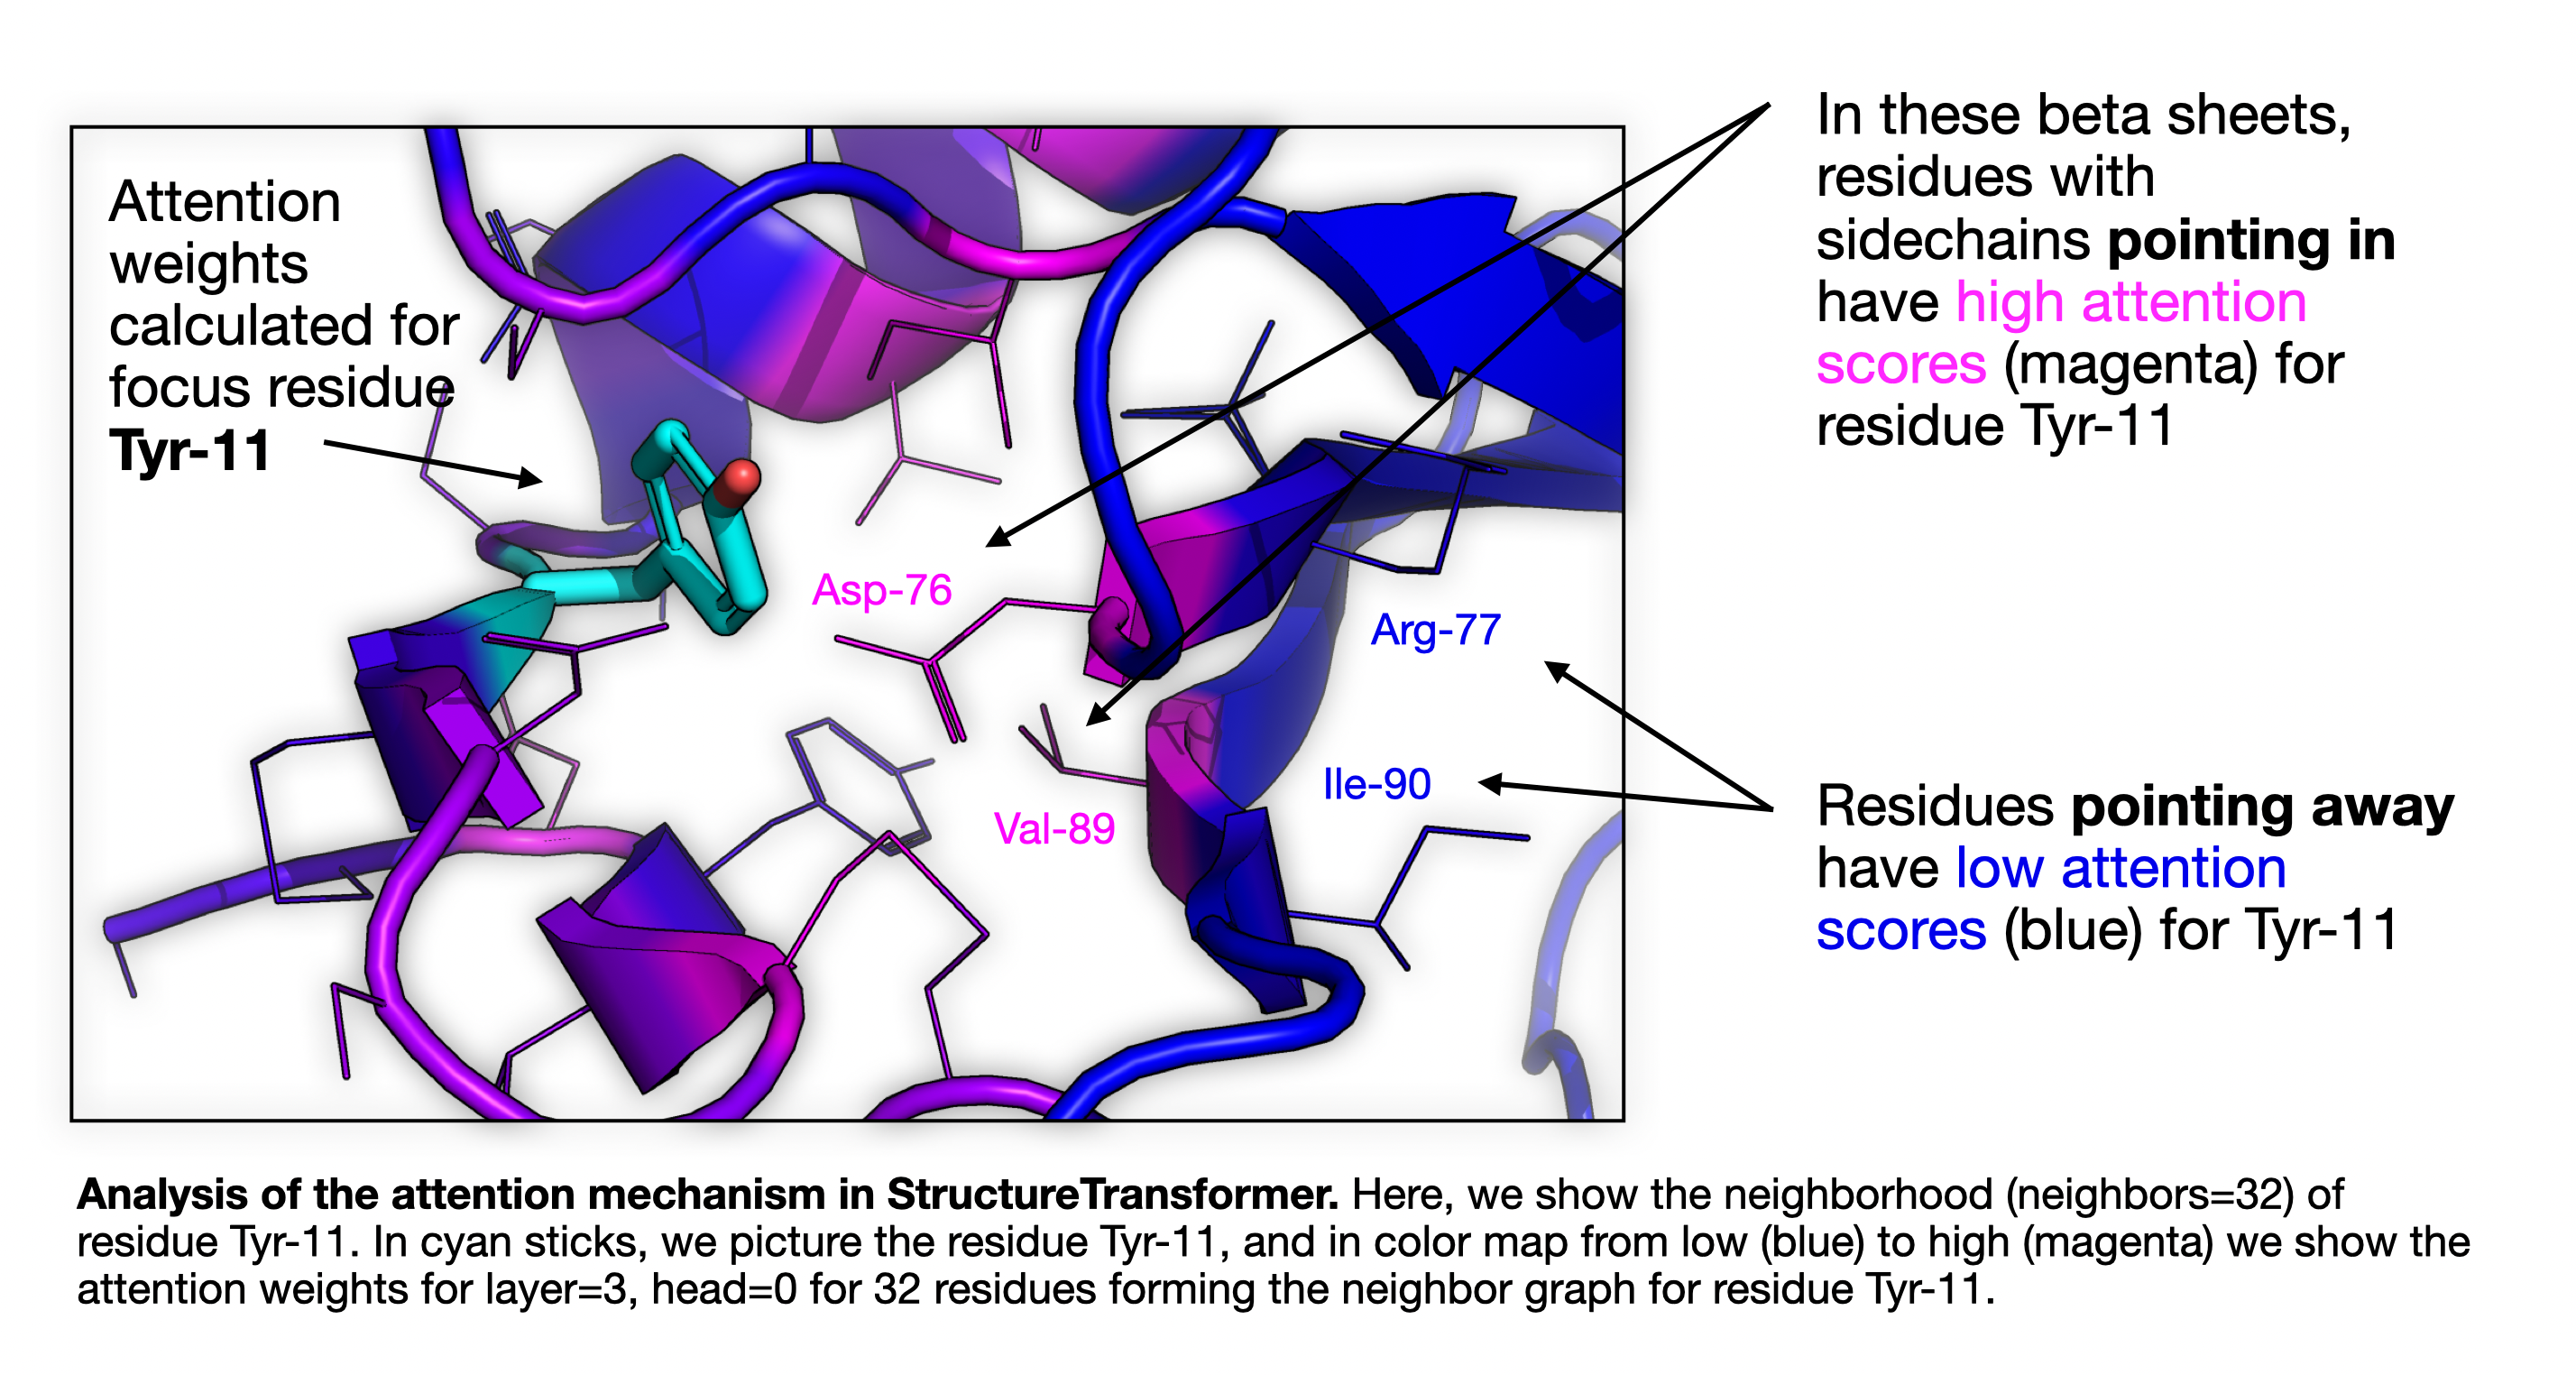
Analysis of the attention mechanism in StructureTransformer. Here, we show the neighborhood (neighbors=32) of residue Tyr-11. In cyan sticks, we picture the residue Tyr-11, and in color map from low (blue) to high (magenta) we show the attention weights for layer=3, head=0 for 32 residues forming the neighbor graph for residue Tyr-11.
This was a fairly arbitrary choice of protein and residue, but there are some interesting features here.
We're looking at residue Tyr-11 in the structure, and then coloring the rest of the structure by the attention weight used at layer 3, head 0 in the StructureTransformer model. The neighborhood size is set to 32, and the neighbor residues are shown as lines. Residues are colored by the attention weight, with brighter magenta being higher, and darker blue being lower.
We can see that, in the three beta strands forming a sheet in the image, that many of the residues are within the neighborhood of Tyr-11, but that the attention makes a striped pattern, paying much more attention to residues that are facing/pointing in towards Tyr-11 than to those pointing away. You can also see this on the left hand side of the figure. Also, note the two disulfide bonds visible in the lower left.
Now let's take a closer look at the other heads in the model. Here, I'll do the same thing but display the output of all four attention heads.
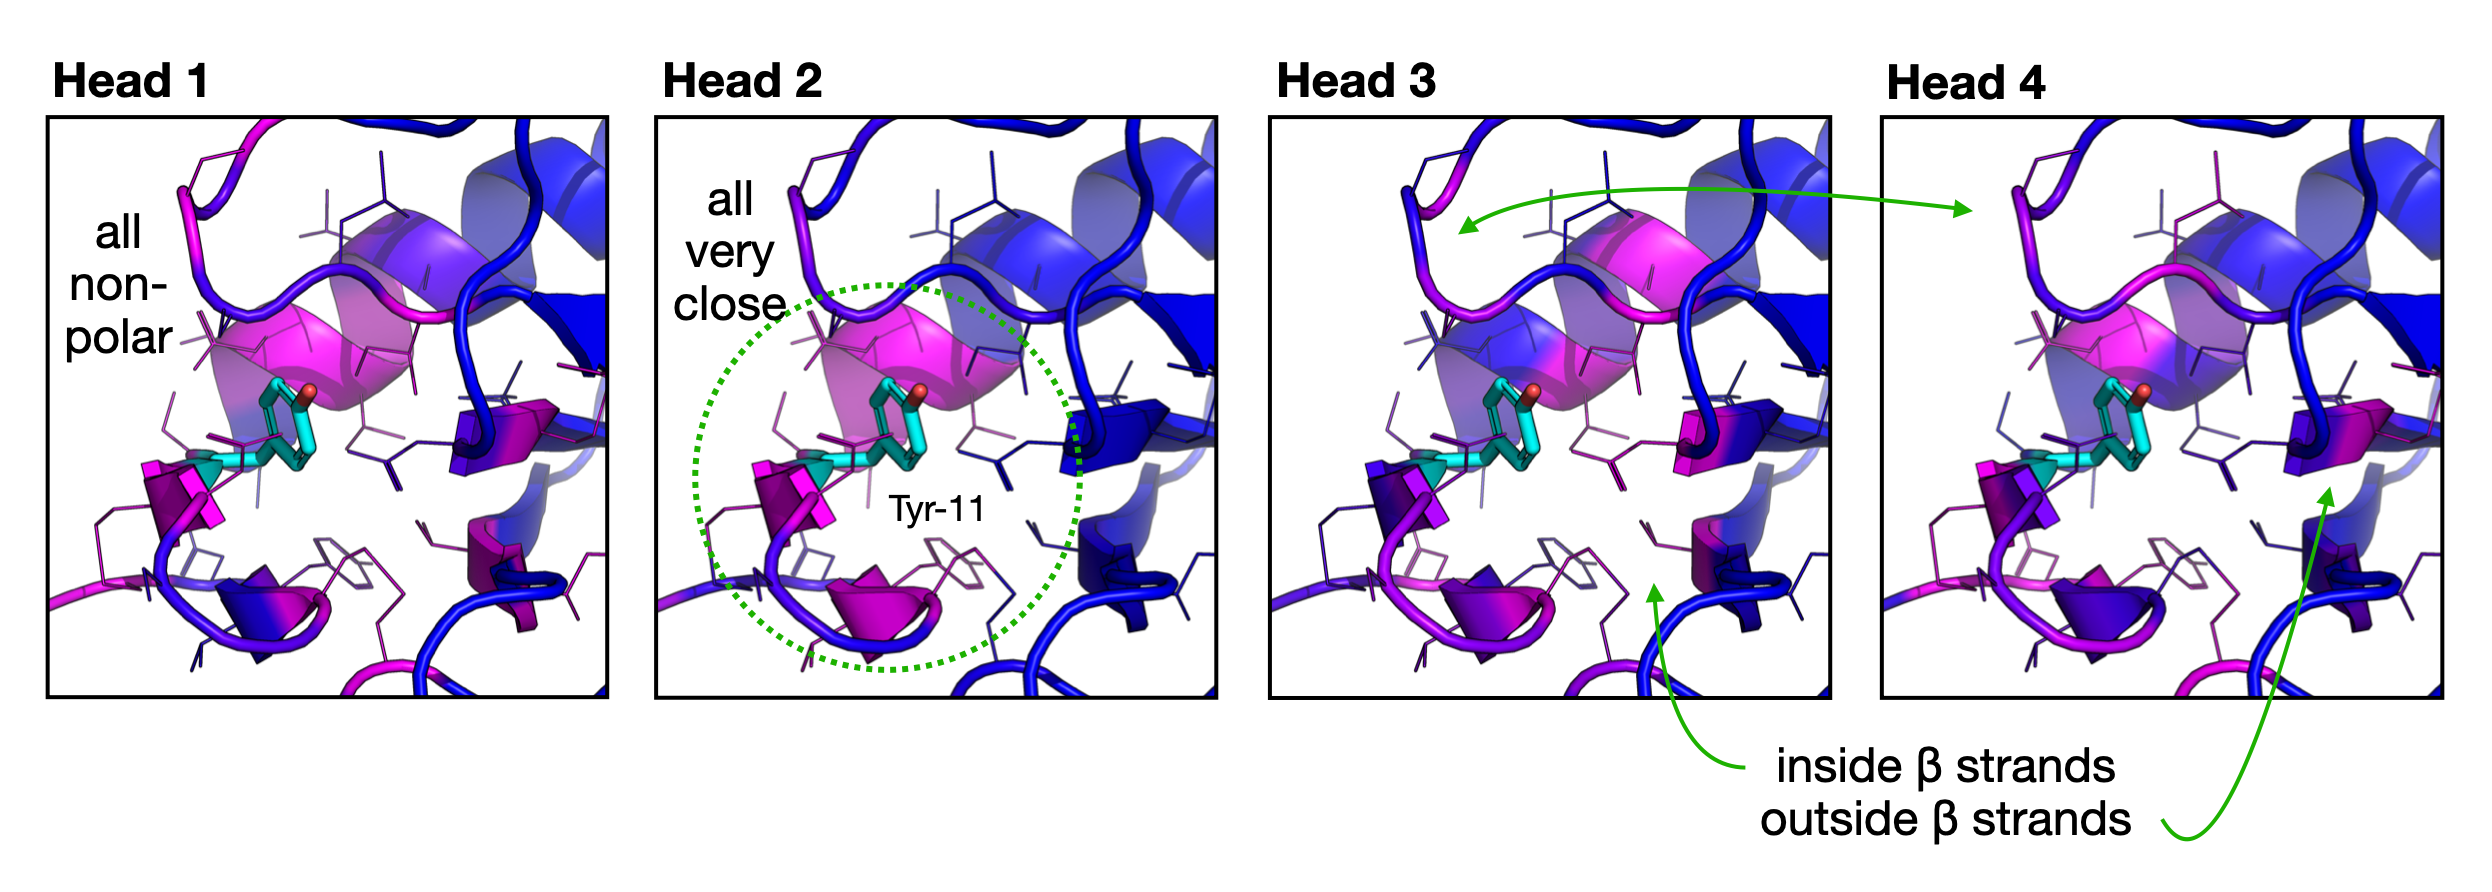
Analysis of the multi-head attention mechanism in StructureTransformer. Here, we are showing the same attention map (blue being low, and magenta being high), for the same residue (Tyr-11, colored cyan) for each of 4 heads in the transformer model. Head 1 seems to focus on non-polar residues, perhaps because Tyr is fairly non-polar. Head 2 is laser focused on the 8-9 residues that are directly touching the Tyr-11, and ignoring everything else. Heads 3 and 4 show a striking alternating pattern, where residues attended to by Head 3 are not attended to by Head 4, and vice versa.
This is a really interesting look at how the different heads have specialized. I wonder what it will look like if we begin to look at substrate-binding residues and catalytic residues. Can we use any of these insights to improve inverse folding (sequence design) models?
How can we improve these models?
The next thing to think about is: given the information we have about the attention, what further analyses would be interesting? What can we learn from this? How can we build a better model?
It would be cool to collect some residue type statistics. Do tyrosine residues on average pay more attention to specific residue types? Do polar residues pay more attention to each other? greasy residues? Do residues within different secondary structures (sheet, helix) display different patterns of attention? Do residues in helices pay more or less attention to the N+1 residue than those in sheets?
It seems like it would definitely help to include DNA, RNA, ligands, and metal ions in the features of the graph, so that the design of each residue can take this into account. I suppose we'll save that for another post.